
Describing bar Graph

How To Describe a Bar Graph
- In the first paragraph, give basic details about the chart including what it shows, where it refers to and when.
- When you describe chart data, be specific. Mention the category and figure, e.g. Online video streaming was the most popular format in 2017. US consumers spent $9.8 billion ...
- A trend is a change over time. To describe trends, focus on what is increasing or decreasing compared to some time in the past, e.g. ... which was a rise of 32 per cent from the previous year.
- If several categories show the same trend, talk about them together, e.g. customers were moving away from the three physical formats in the chart.
- State the units of measurement, e.g. US consumers spent $9.8 billion.
- Many of the verbs for up and down trends can also be used as nouns, e.g. Spending fell by 21 per cent = There was a 21 per cent fall in spending. (You can write % or per cent, but be consistent.)
- Write a conclusion. Say what we learn from the data overall.
Sample bar chart Description
The chart below shows the percentage of people who ate 5 portions of fruit and vegetables per day in the UK from 2001 to 2008.
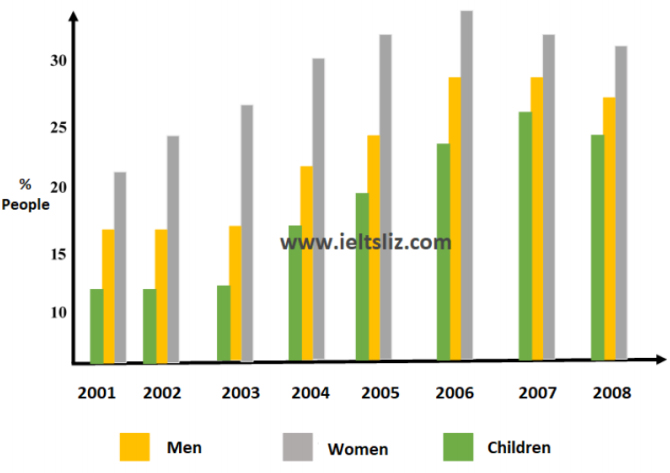
The chart demonstrates the percentage of UK residents who ate five portions of fruit and vegetablesdaily, during a seven-year period, ranging from 2001 to 2008, split by three categories of : men, women and children.
Taken together , the consumption of fruits and vegetables by British women always remained the highest in the given timespan, followed by men in the second level and children who recorded the least amount of consumption.
Staying at nearby 22% in 2001, the women were the major consumers of fruits and vegetables. From 2001 to 2006, there was a considerable upward trend, peaking at over 35% in 2006 but dipping in the next years. Likewise, the trend regarding men showed upward; however, there was a considerable difference between these two groups percentage in each year. From 2001 to 2003, for instance, the number of male consumers stood at merely 17%. There was an increase in the following years, resulting in the pinnacle of around 27% in 2006 which far less than the record made by the women in the UK.
Children`s percentage , as the youngest consumers of the three categories, and the lowest in the category, remained static in the first three years, at nearby 13%, followed by a considerable increase to the zenith of only 25 % 2007 . This rate , however, dropped to approximately 23 % in the following year.
BY : Rojano
| Credit | Description | Bandscore |
|---|---|---|
| LR | There are variety of pertinenet words and expressions used in this description | 7 |
| C C | majority of the sentences and description are ath the service of the description . No redundencies were found | 7 |
| GR | Applicable and correct grammar was deployed , representing both the current and future statement of the map | 7 |
| TA | what is anticipated from the description of this map is actually met. | 7 |
| 7 | ||